Factors to Consider Before Selling Soybeans and Corn in the 2026/27 Season
Read more
Grupo Globo
g1.globo.com

Factors to Consider Before Selling Soybeans and Corn in the 2026/27 Season

The 2026/27 season begins for producers amidst numerous critical decisions. In a scenario where costs, yields, exchange rates, and the international market are rapidly changing, the sale of soybeans and grain crops should not be based solely on the feeling of whether 'the soybean price is good or bad.' Pre-selling soybeans, just like decisions regarding corn, requires considering margins, cash needs, and risk exposure. This is where risk management in agribusiness becomes part of the farm's strategy.

The scale of the next season underscores the importance of these decisions. Initial forecasts published by the National Supply Corporation (Conab) indicate that Brazilian grain harvest in the 2026/27 season could reach 366.6 million tons. The initial forecast for soybeans is around 181.6 million tons, and the total corn production volume may approach 148 million tons. These figures help assess the market but do not answer the main question within each farm.

When is the right time to sell?

The answer is rarely found in a single quote. Before making a commercial decision, at least eight aspects must be considered.

1. Start with the cost of production, not the quote

The question 'How much does a bag cost at price X?' is common, but it lacks fundamental information to answer it: 'Good for whom?'. One price might provide an interesting margin for one farm but be insufficient for another. This occurs due to differences in cost structure, yield, rent, financing, storage, logistics, and operational efficiency. Therefore, before looking at Chicago, the dollar, or the exchange price, the producer must know their own metrics.

It is necessary to answer: How much does it cost to produce a bag? What is the break-even point? At what price does the margin corresponding to business risk begin to be secured? Consider two producers selling soybeans at a fixed rate of 130 reais per bag. If the first's actual cost is 95 reais, and the second's is 120 reais, they face the same quote but completely different commercial situations. The market price is the same, but the margin is not. This approach changes the way commercialization is done.

Calculate before deciding

To aid in this analysis, Agrinvest provides a free tool to simulate the minimum price for stored soybeans. With its help, the producer can enter their data and get a clearer reference point before making a commercial decision.

2. Price is not margin

This is perhaps one of the most important points for the 26/27 season. Commercialization often draws attention to the nominal price of the bag. However, a high price does not automatically mean a better result. If costs have also increased, part of that profit disappears. Similarly, a price below the historical record can represent a good commercial opportunity if it guarantees an interesting margin for that specific farm. Therefore, the question 'Will it increase further?' can be replaced by more useful questions: What margin does this price give me? Does this margin match my planning? What production volume makes sense to lock in at this level? What risks am I eliminating by making this sale? What opportunities am I preserving?

This seemingly minor shift completely changes the logic of commercialization. The goal ceases to be hitting the market peak; it transforms into building results throughout the entire season.

3. What production volume is already reserved?

Another common mistake is to view every sales offer in isolation. Imagine a favorable opportunity arises today. Before concluding the deal, one should ask: what volume of expected production has already been sold? There is a significant difference between a producer who has reserved 10% of their volume and one who has already concluded deals for 70%. A new sale will affect each of them differently. Therefore, commercialization must be viewed as a portfolio of decisions. A producer can divide their volume across different times, prices, instruments, and strategies. This reduces dependence on hitting one specific date. It also allows tracking the season's development. As weather, yield, and the market become clearer, new percentages can be sold. There is no universally correct percentage for everyone. The central point is knowing what volume is already reserved, what remains at risk, and why.

4. Consider climate risk before pre-selling

Pre-selling soybeans and corn can be an important tool for seizing opportunities and reducing price uncertainty. But there is a downside to this decision: production risk. When a farm sells before harvest, it takes on a delivery obligation. If yield decreases, the available volume may be less than planned. Therefore, price and climate cannot be analyzed separately. The decision to pre-sell must take into account factors such as: the farm's historical yield; the crop stage; weather forecasts; actually planted volume; confidence level in production; the amount already locked in previous contracts. The higher the uncertainty regarding yield, the more important it is to carefully assess the reserved volume. At the national level, Conab itself notes that the results of the 26/27 season will depend on weather conditions during crop development. This is another example that commercialization is not just an attempt to beat the price; it is a necessity to manage various risks simultaneously.

5. Chicago went up. Does that mean Brazilian soybeans will also rise?

Not always. To understand the price of soybeans in Brazil, it is necessary to observe various components. Among the most significant are Chicago + exchange rate + premium + basis + local market conditions. The combination of these factors helps explain why a positive movement in one of them does not always fully reflect in the price received by the producer.

Chicago

The Chicago Exchange is one of the main international benchmarks for soybeans and corn. Quotes can react to factors such as: US harvest; climate; global stocks; Chinese demand; fund positions; USDA reports; global supply and demand. But Chicago is only part of forming the Brazilian price.

Exchange Rate

The dollar has a direct impact on converting international benchmarks into reais. This means Chicago can rise while the dollar falls simultaneously. Depending on the magnitude of each movement, some of the growth may be canceled out. The reverse also happens. A stronger dollar can help maintain prices in reais even when international quotes decline.

Premium

The premium reflects specific export market conditions. Brazilian supply, international demand, port availability, and the pace of commercialization can change this component. Therefore, only watching the Chicago screen means missing the whole picture.

Basis

It depends on regional supply and demand conditions, location, logistics, product availability, and the timing of commercialization. Understanding this dynamic allows one to see opportunities that might be unnoticed when looking only at the main quote. Such comprehensive reading is one of the competencies of specialists involved in professional commodity commercialization.

6. Cash flow needs are also part of the strategy

Not every commercial decision will be made at the most advantageous market moment. The farm has obligations. Resources, rent, salaries, financing, equipment, storage, and various expenses need to be paid. Therefore, the commercialization strategy must align with the farm's cash flow. Imagine a producer who believes in a rise in soybean prices in the coming months and decides to leave 100% of production exposed to risk. The market hypothesis may be correct. But if they urgently need to sell to meet a financial obligation, they may be forced to negotiate at an unfavorable time. The problem in this case was not necessarily in market analysis, but in the lack of connection between commercialization and cash flow. Preliminary planning of volumes that can cover known obligations reduces the need for decisions made under pressure.

7. Pre-sale or waiting for the market?

This is likely one of the most frequent questions in the 26/27 season. And it represents a false dilemma. The decision does not always have to be: sell everything now or wait for everything. There is an intermediate path. Commercialization can happen in stages. Some portion can be sold in advance to secure a certain margin, while another can remain open for future opportunities. Futures contracts, options, and other strategies allow for building various combinations of hedging and market participation. This does not eliminate risks but expands available alternatives. The fundamental point is understanding what risk each instrument mitigates and what risks remain.

8. Work with scenarios, not certainty

Perhaps the most important skill in commercialization is accepting uncomfortable reality: no one knows for sure what the market will do. Chicago can rise or fall. The dollar can change direction. The climate can improve or worsen. China can accelerate purchases or reduce its presence. Therefore, a good plan should not depend on a single forecast. The alternative is building scenarios.

Scenario 1: The market improves. If Chicago rises, the dollar remains stable, and premiums improve, what is the strategy? Is there a target price for selling another batch? Scenario 2: The market stabilizes. If quotes remain close to current levels, is the margin still interesting? Are there cash obligations that need to be met? Scenario 3: The market deteriorates. If Chicago falls or the exchange rate reduces the competitiveness of the Brazilian price, what part of the margin will be protected? What production volume is still at risk? Preliminary consideration of these possibilities reduces emotional decisions. Instead of reacting to every daily movement, the producer starts executing the plan.

The task is not prediction. The task is making the best decisions.

Agricultural commercialization is often associated with trying to guess the next market move. But this is not necessarily the main skill of a good merchant. The task is to make consistent decisions, even without knowing the future. To do this, the producer can track a number of indicators: cost per bag; break-even point; projected margin; expected yield; percentage of commercialized production; average selling price; cash needs; Chicago; exchange rate; premium; basis; remaining risk. With this organized data, the question ceases to be simply: 'What is the soybean price today?' It turns into: 'What does this price mean within the framework of my strategy?' This is an important distinction.

Agrinvest works with both sides of this knowledge: education and the market. Understanding commercialization in theory is important. But this knowledge takes on a different dimension when it arises from the practical experience of those who participate in the market daily. Agrinvest Commodities has been operating in the commodity market since 1987 and offers solutions including market analysis, risk management, physical market intermediation, and access to futures markets. The company is also present in the daily operations of trade intermediation and risk management, connecting buyers and sellers in physical and international markets and supporting various chain participants.

Similar stories

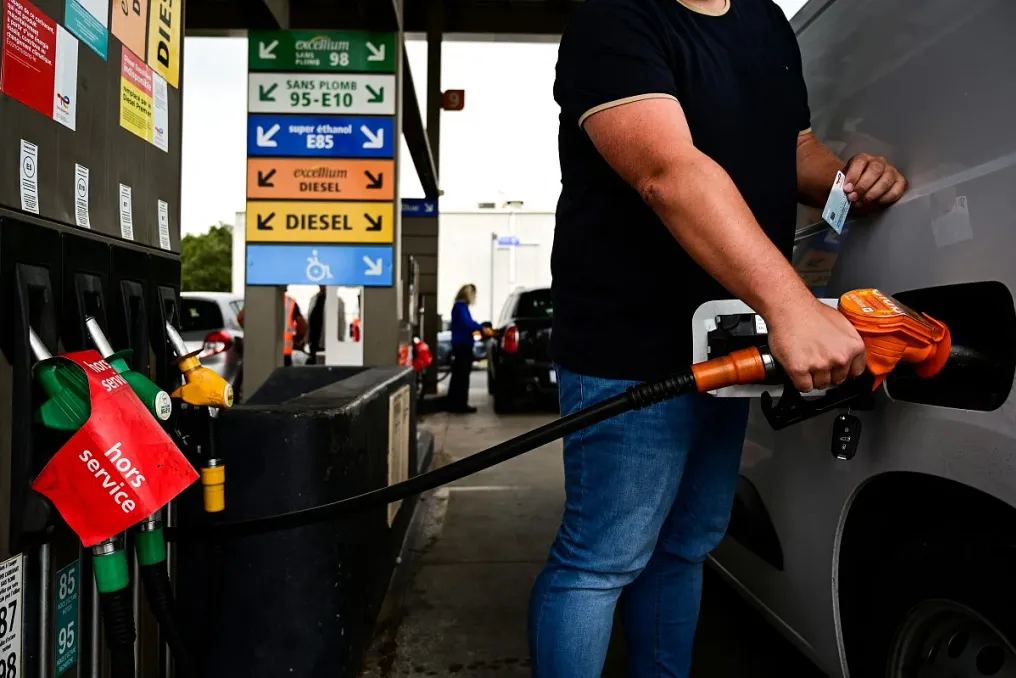
Rising fuel prices in South Africa intensify inflation and may lead to interest rate hikes
Read more
iol.co.za

Rising fuel prices in South Africa intensify inflation and may lead to interest rate hikes

The increase in fuel costs could trigger inflation and potentially lead to higher interest rates. South Africans may face another rate hike as rising petrol prices contribute to inflation, starting a vicious cycle that undermines already strained household budgets.

Investec Chief Economist Annabel Bishop forecasts that in October, petrol and diesel prices will rise by approximately 3 rand per liter. She noted that this will again push CPI inflation to an annual rate of 5% and could prompt another repo rate hike for South Africa in November.

In August, inflation stood at 4.4%, slightly exceeding the July figure. Meanwhile, transport cost growth increased by 8.8% year-on-year.

Bishop pointed out that market concerns regarding fuel prices, linked to the Middle East war and its impact on oil, petroleum products, and commodities, have grown as the conflict escalates and fears of its spread in the region mount.

She also reported that a further rate hike of 0.25 percentage points is expected for the remainder of the year. If the 25 basis point increase raises the base rate to 11%, it will affect households even before they fill up their cars.

Up to 11%

If another rate hike raises the base rate from 10.75% to 11%, the monthly payment for a R1.5 million mortgage over 20 years will increase from approximately R15,228 to R15,483, adding R255 to monthly payments.

Furthermore, a car loan of R500,000 over six years will rise from about R9,453 to R9,517 per month, increasing the burden by another R64 monthly. Thus, for a household with both debts, this amounts to about R319 per month, not including the impact of higher costs for fuel, transport, and food.

According to the latest quarterly bulletin from the South African Reserve Bank, household debt in the first quarter was 62.2% of disposable income, with the cost of servicing debt reaching 8.4%.

The situation appears significantly worse among consumers who are already under financial pressure. A DebtBusters Money-Stress Tracker survey, based on data from nearly 18,000 respondents, showed that 53% spend more than 40% of their net income on debt repayment, up from 48% the previous year.

Among respondents earning over R20,000 per month, 75% spend more than the recommended 30% on debt, while those earning over R50,000 per month theoretically might be paying more on loans than they earn.

No More Money

Consumers seeking debt restructuring are in an even more difficult position. The South African Financial Stress Index showed that the median applicant at Debt Solutions 4U between June and August was already dedicating 58.4 cents of every rand received to debt repayment.

This data covers 1,174 debt restructuring applicants and is not representative of all South African households.

Next comes the need to fill the tank.

Available funds to cover these expenses have barely increased. PayInc data shows that average net income rose from R21,399 in March to R21,622 in August, representing only slightly more than 1%.

In real terms, the average net income in August was R20,164, which is 2.6% less than the previous year.

Reality Hits

Meanwhile, the price of 95 petrol in rural areas has risen from R20.30 per liter in March to R26.92 in September. Latest data from the Central Energy Fund indicates an additional increase of approximately R3.16 per liter in October.

This will raise the price of 95 petrol to approximately R30.08 per liter before other adjustments are factored in.

In March, filling a 45-liter tank cost R913.50, corresponding to 4.3% of the average wage at that time. At a price of R30.08 per liter, this will cost R1,353.60, or 6.3% of the latest average wage.

Filling a 60-liter tank will increase from R1,218, or 5.7% of the net income, to R1,804.80, or 8.3%.

Filling a 70-liter tank will rise from R1,421, or 6.6% of the average income, to R2,105.60, equivalent to 9.7%.

After that, there is still to eat.

This shock in diesel prices also affects trucks transporting goods and other commodities across the country. The Road Haulage Association states that fuel accounts for between 35% and 55% of road transport companies' operating costs. Based on the increase in diesel prices in September, they estimate that transport operating costs could rise by approximately 4% to 6%.

Over 80% of land transport is conducted on roads, including the movement of produce between farms, processors, distribution centers, and retail stores.

However, the increase in transport costs does not always directly lead to a proportional increase in supermarket shelf prices.

Some Good News

PSG Senior Economist Johann Els noted that there has been no noticeable transfer of higher prices for petrol and diesel into the prices of food and other consumer goods. He stated: 'Food inflation has actually decreased compared to the beginning of this year to the current level.'

Instead, consumers forced to spend more on fuel and transport have less money for other purchases, which, according to Els, creates a substitution effect. Els also suggested that wholesalers and retailers might absorb some of the increase instead of passing it on to consumers and risking lost sales. Consequently, higher fuel costs could cause 'deflationary forces' as consumers spend more on transport and less on other items, while businesses try to maintain sales volumes.

Despite this, the cost of the food basket, measured by the Pietermaritzburg Economic Justice and Dignity Group Household Affordability Index, has increased by 2% year-on-year, averaging just under R5,500. The annual increase in the cost of staple foods purchased in the household basket was 2.9%.

Vande Bharat Sleeper high-speed train to start service on Bangalore-Mumbai route soon
Read more
www.aajtak.in

Vande Bharat Sleeper high-speed train to start service on Bangalore-Mumbai route soon

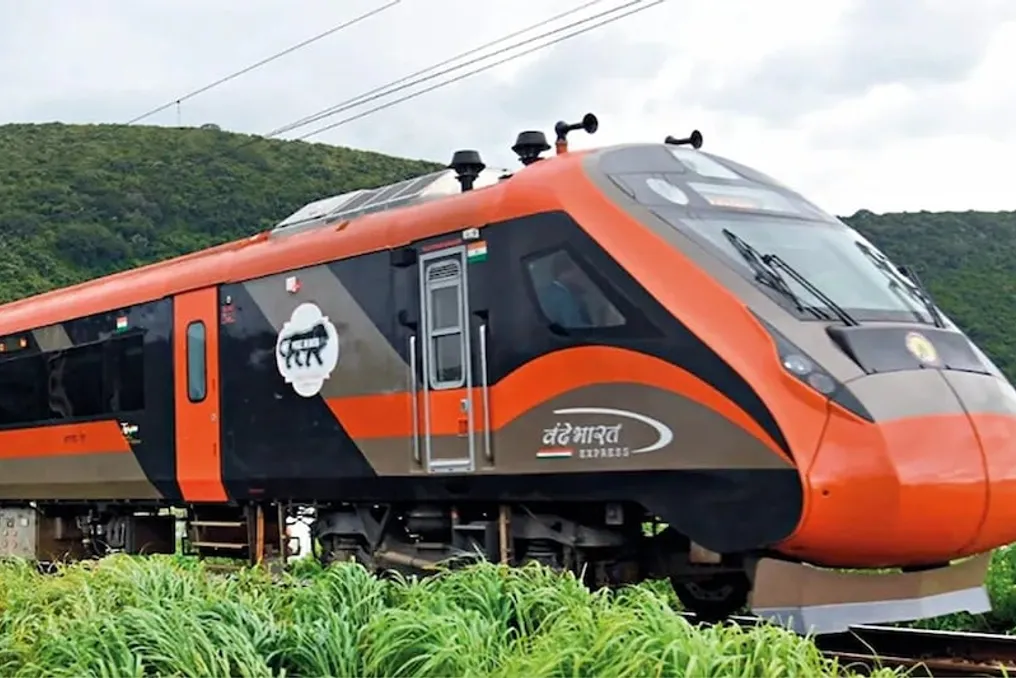
Currently, the journey from Bangalore to Mumbai by train takes about 22–24 hours. However, it is expected that the launch of the Vande Bharat Sleeper train between these two cities will reduce travel time by 6–8 hours. This train is anticipated to begin operations this month.

According to the proposed schedule, the trip from Bangalore to Mumbai will take 16 hours and 5 minutes. The return journey from Mumbai to Bangalore is estimated to last about 15 hours and 45 minutes. This route will be the first Vande Bharat Sleeper high-speed train in South India.

The proposed railway route is approximately 1137 kilometers long, fully electrified, and equipped with double tracks. Most of this section allows for speeds of up to 130 kilometers per hour, making it an attractive option for high-speed service. The train is designed to meet the needs of passengers undertaking long overnight journeys.

Although the final launch date and schedule are awaiting official announcement from the railways, the proposed timetable includes the train departing from SMVT Bengaluru terminal at 19:50 and arriving at CSMT Mumbai terminal the next day at 11:55. For the return trip, the train is planned to depart from CSMT Mumbai at 20:10, arriving in Bangalore at 11:55 the following day.

According to sources, the Vande Bharat Sleeper train route between Bangalore and Mumbai may have stops at certain stations. Potential train numbers 27651 and 27652 are mentioned, but final confirmation of stops and numbers is still pending. These details will be determined after an official statement from the railways.

Under the initial plan, the train was supposed to start from the SMVT station in Bangalore. However, there is a requirement to launch the train from the main railway station of the city, KSR Bengaluru, as it is more convenient for passengers. The initial announcement for the train launch was made in September 2025, and now the decision from the railways regarding the starting station must be awaited.

Two sets of 16-coach Vande Bharat Sleeper trains have been prepared for this service. Their construction was carried out by Bharat Earth Movers Limited (BEML) under the Integral Coach Factory (ICF) program. According to sources, one set is located at the Bangalore depot, and the second is in Vardapur, near Bangarapet. The Railway Commission may soon issue an official notification regarding the transfer of these sets to the South Western Railway.

The total composition of the proposed Vande Bharat Sleeper train will consist of 16 coaches, including 11 3AC class coaches, 4 2AC class coaches, and 1 1AC class coach. The approximate ticket price in 3AC class is around 3000 Indian rupees. It is expected that breakfast and meals will be included in this price, as Vande Bharat trains provide meal selection on long journeys. The railway anticipates that the lower price and shorter travel time compared to air travel will make this service popular among passengers.

Explanation of Differences in Gasoline Prices Between European and Arab Countries
Read more
www.khaleejtimes.com

Explanation of Differences in Gasoline Prices Between European and Arab Countries

The difference in fuel cost between European and Arab countries is significant, even though both groups of countries are influenced by the global oil market. For example, filling a 50-liter sedan in Qatar costs the driver about $29, whereas the same operation in Germany can cost approximately $132.

Despite rising fuel prices in many countries due to increased global crude oil prices and geopolitical tensions, the impact of this rise on the final price at the pump varies greatly depending on the driver's region of residence.

In the United Arab Emirates, the price of Special 95 gasoline reached 4.28 dirhams per liter in October, up from 3.69 dirhams in September. This is equivalent to approximately $1.17 per liter, amounting to about $58 for a full 50-liter tank.

However, prices differ in other parts of the Arab world. In Qatar, Super 95 remains at 2.10 Qatari riyals per liter, or about $0.58, which costs approximately $29 to fill a 50-liter tank. Egypt is even cheaper: gasoline with an octane rating of 95 costs 24 Egyptian pounds per liter, which is approximately $0.46 at the current exchange rate, and a full 50-liter tank costs about $23.

Jordan demonstrates that the Arab world cannot be considered a single fuel market. After a rise in global oil and petroleum product prices in September, the country increased the price of 95-octane gasoline to 1.36 Jordanian dinars per liter in October. Filling a 50-liter tank in Jordan will cost approximately $96 at a price of about $1.92 per liter, which is closer to European prices than in Qatar, Egypt, or the UAE.

European motorists generally pay significantly more. According to the latest data from the European Commission, the price of gasoline in Germany is about €2.35 per liter, in France—€2.21, in Italy—€2.16, and in Spain—€1.94.

To fill a 50-liter tank, this corresponds to approximately $132 in Germany, $124 in France, $122 in Italy, and $109 in Spain. This contrast is striking: the same amount of fuel costs about $29 in Qatar and $58 in the UAE, while in Germany the bill can exceed $130.

The price difference is not only due to which countries extract oil. Crude oil is only one component of the final price seen by drivers at the pump. Taxes constitute a significant portion of prices in Europe. Governments introduce excise duties, value-added tax, and other fees, causing drivers to pay more than just the basic cost of the fuel itself.

The European Commission publishes both pre-tax and post-tax prices, demonstrating the contribution of taxes to the total amount paid by consumers. Furthermore, higher oil prices exert additional pressure. This week, the European Commission reported that prices remain high despite stable oil supplies, with several member states beginning to implement measures to mitigate the impact on consumers.

There is no unified fuel pricing system in Arab countries. Some Gulf countries, which are oil producers, maintain relatively low domestic prices, while other governments use subsidies or regulated prices to slow the transmission of global market changes to consumers.

The UAE applies a monthly fuel pricing mechanism that reflects fluctuations in global energy markets, allowing international price changes to appear relatively quickly at gas stations. Jordan also reviews fuel prices monthly, but authorities have stated that the government is gradually adjusting prices rather than passing on the entire increase in international prices to consumers. Meanwhile, Egypt continues to regulate domestic fuel prices, creating an additional barrier between movements in the global oil market and what drivers ultimately pay.

The comparison shows why two drivers might fill identical cars on the same day and receive drastically different bills. Oil may trade globally, but the price at the pump is largely determined by the location of that station.

Popular